Python > Assignment #10: Visualizing data
Deadline: Wed 30. 11. 2016, 07:47 CET
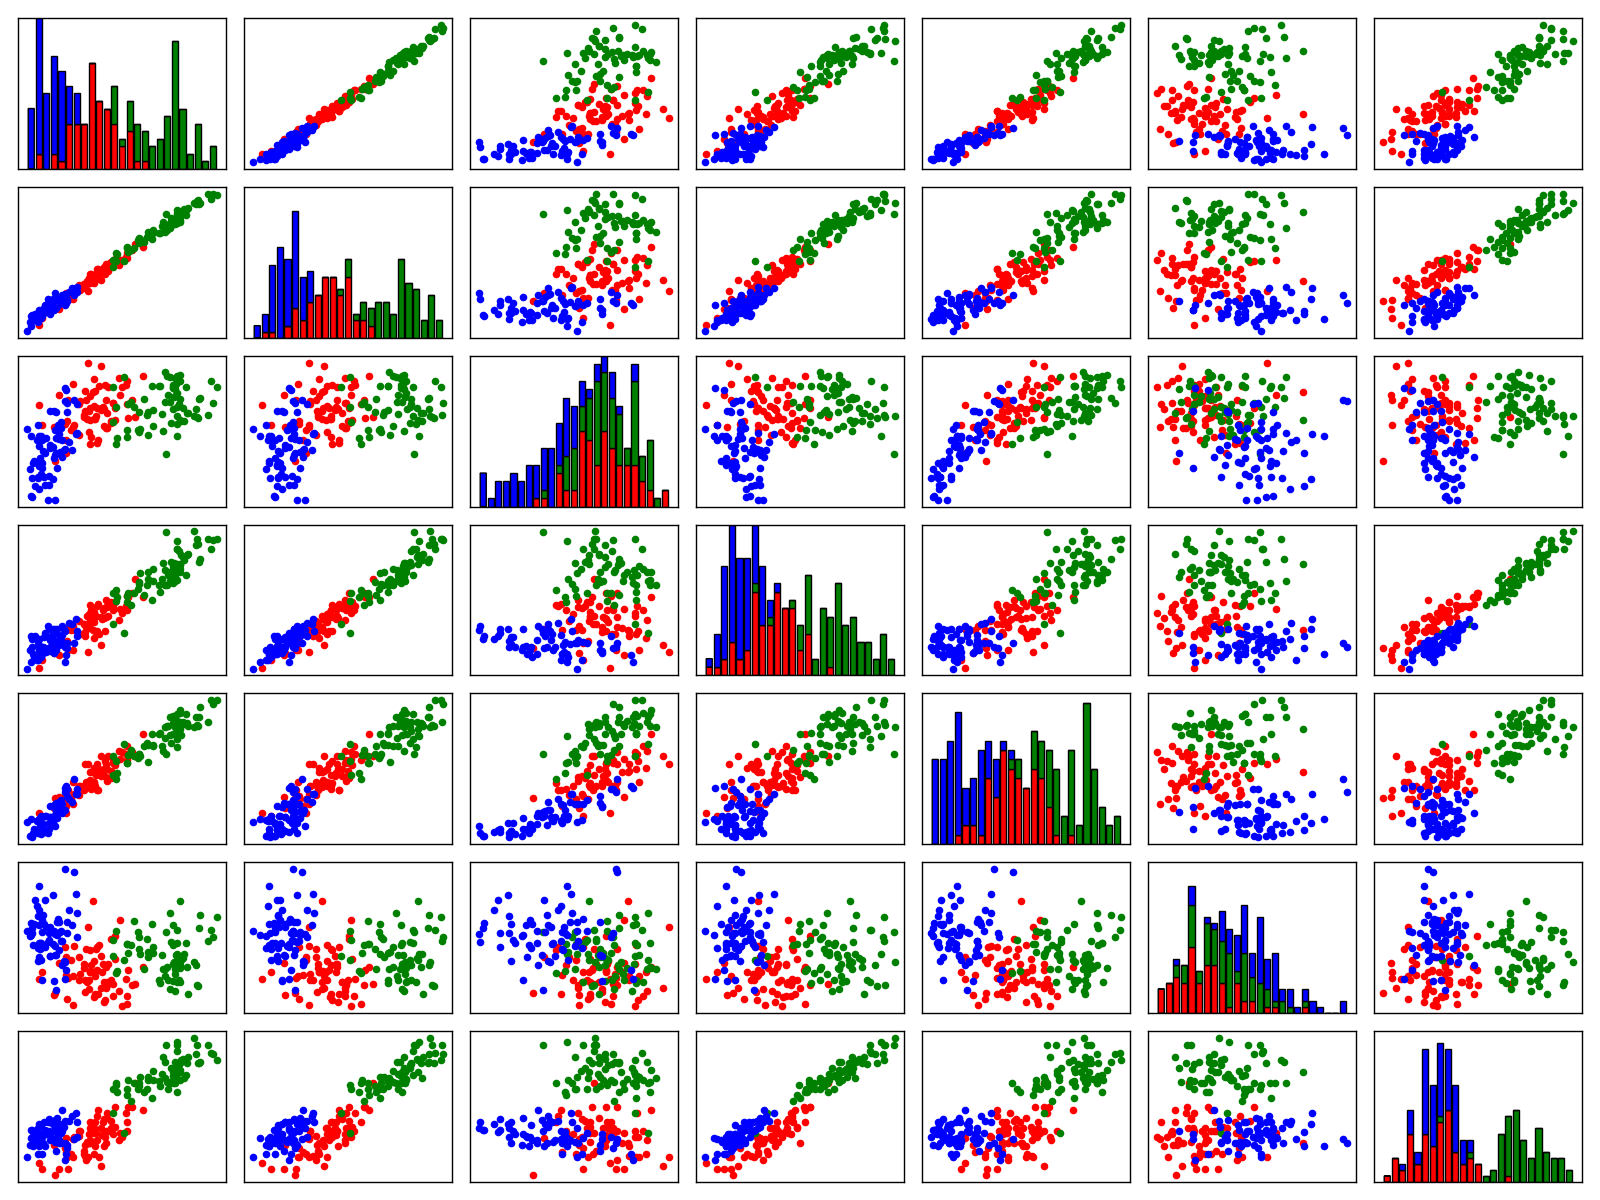
Assignment: Plot a full scatter plot for the Iris flower data set (wiki).
This dataset has four features (4D data) and three classes, so the resulting plot will be a 4x4 grid of subplots. The i-th diagonal entry should contain a histogram visualizing the distribution of values for the i-th feature. In the rest of the entries, the subplot in the i-th row and j-column should show a scatter plot of j-th feature (X axis) versus the i-th feature (Y axis), plotting the different classes of inputs (last column) in different colors.
Example:
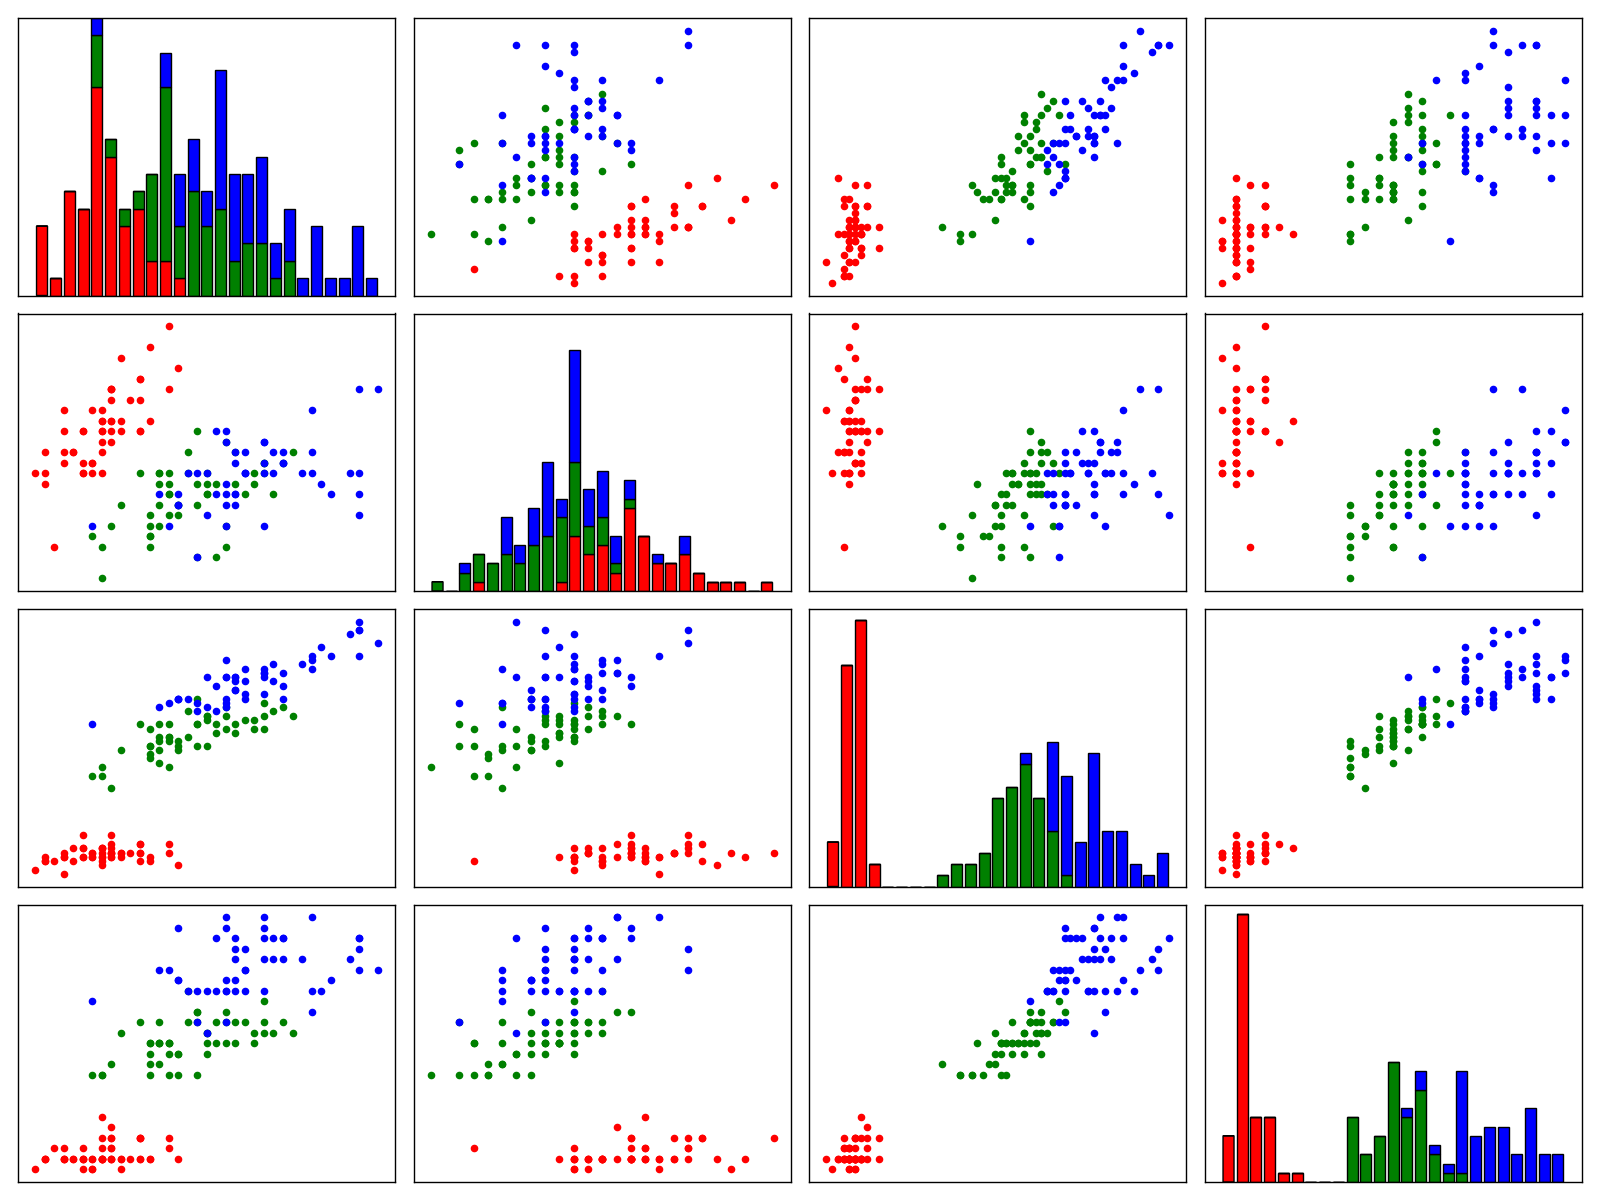
Bonus: Extend the program to be able to visualize any classification dataset – any number of features, classes and inputs. (Use the provided datasets in the same format for testing.)
Files: iris.dat, seeds.dat, linsep.dat, glass.dat
Example: seeds dataset: